
Sustainability with insight into the carbon footprint
Sustainability is a key theme in the Vion strategy. This includes topics and objectives that are important for sustainable food production and consumption. One of the topics is carbon footprint.
Vion reports the carbon footprint of production processes and the products that we produce. The carbon footprint provides insights into all greenhouse gasses that are emitted during the production of our products, from farm to fork. The most important greenhouse gasses in animal production are carbon dioxide (CO2), methane (CH4) and nitrous oxide (N2O).
With these calculations, we have two goals:
- Inform the farmers on their performance regarding the carbon footprint, to show where they are and to help them improve;
- Inform customers on the carbon footprint of our products, to allow them to inform consumers for an informed choice regarding sustainable foods.
We follow the calculation guidelines as published by the EU, which are called the product environmental footprint (PEF) guidelines. Our approach includes amongst others the so-called life cycle assessment methodology, and use actual data from the farms where our animals originate from.
By mapping the carbon footprint of the chain, we are able to market products with a lower carbon footprint than today’s articles and provide customers and consumers with information about the footprint of the products they buy.
Our main goal: to achieve net zero emissions throughout our supply chain by 2045 at the latest
Background
Informing ourselves
Vion calculates the greenhouse gas emissions of all her production locations on a quarterly basis. These data provide insight into the major emission sources and help prioritize the necessary steps towards our ambition to reach net-zero emissions across our supply chains by 2045 at the latest. The data also shows that more than 95% of the total carbon footprint occurs elsewhere in the supply chain, before animals and products reach Vion. This means that cooperation in the supply chain is key in reaching our goals.
Informing farmers
Vion calculates the total carbon footprint per farm and report back to the farm the total number, as well as the origin of the carbon footprint in the supply chain. These categories include animal feed, manure storage, methane emissions from live animals, transport, energy usage on farm and slaughter.
Insight in the break-up helps farmers to prioritize and improve, together with their advisors from for instance the feed industry. Based on the first results, our farms in the Netherlands and Germany belong to the top-10% worldwide when it comes to a low footprint (see Figures 1 and 2). The footprint is comparable to certain plant-based protein sources.
Furthermore, we see important roles for animal feed and manure storage in reducing the carbon footprint substantially (see Figure 3). Together with among others retailers we set targets for the short-, mid- and long term that are data-driven, science-based and realistic. Honest earnings for all supply chain partners, including the farmers, is an essential component of these discussions.
Informing customers
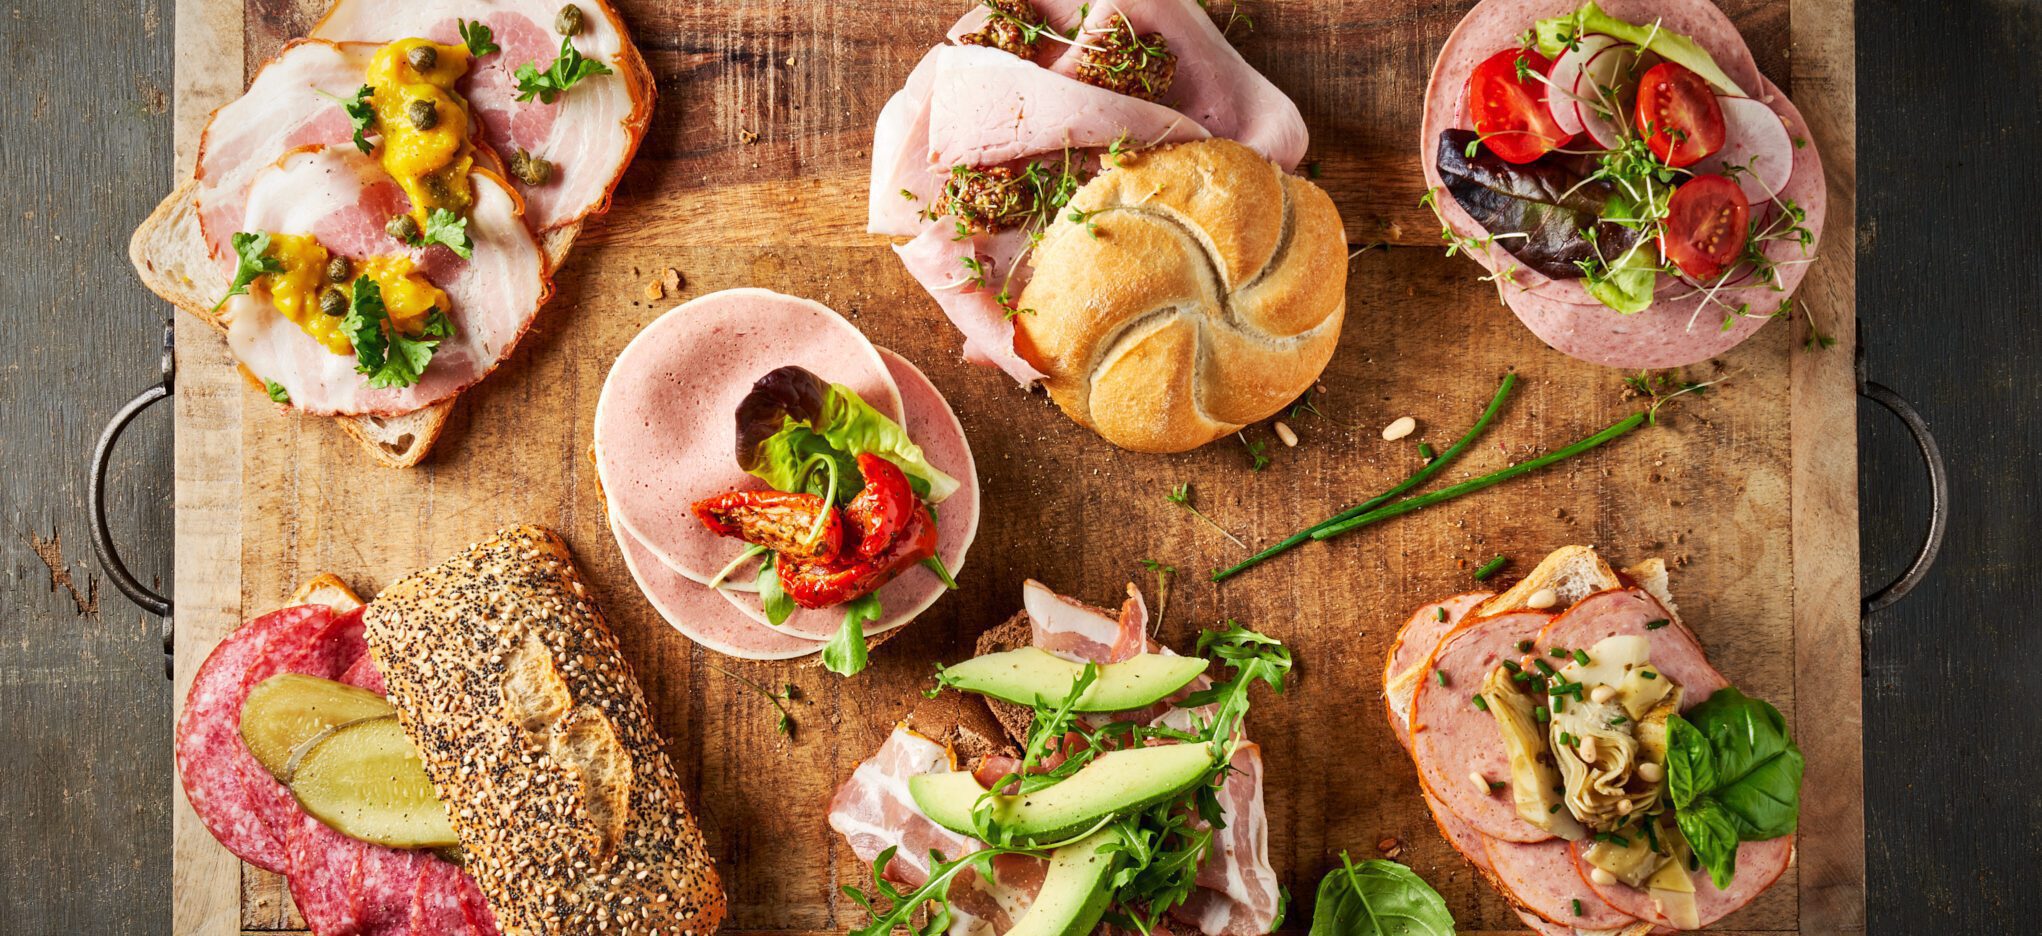
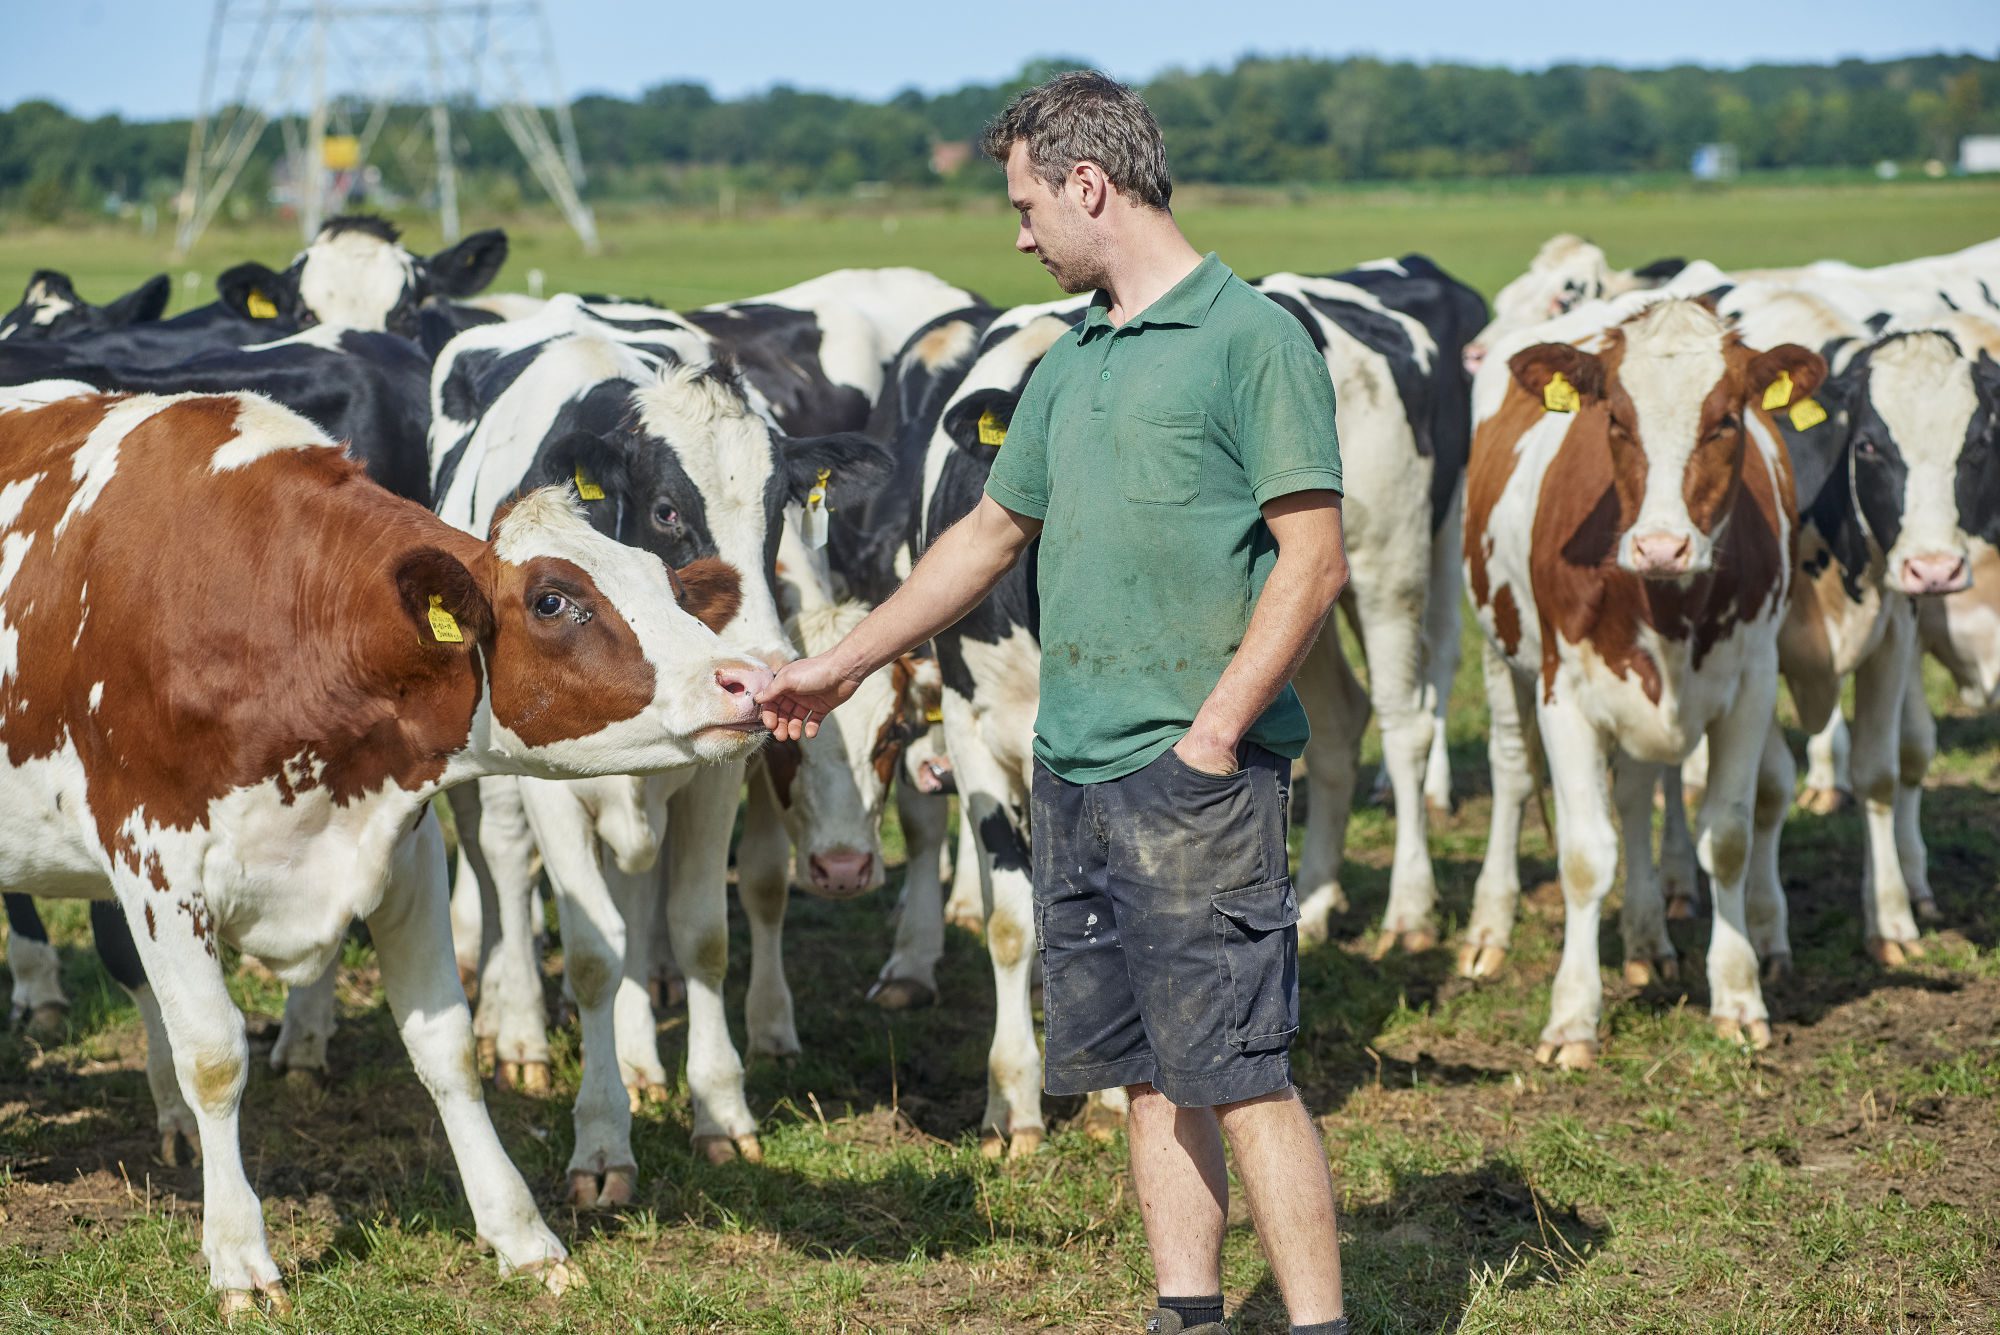
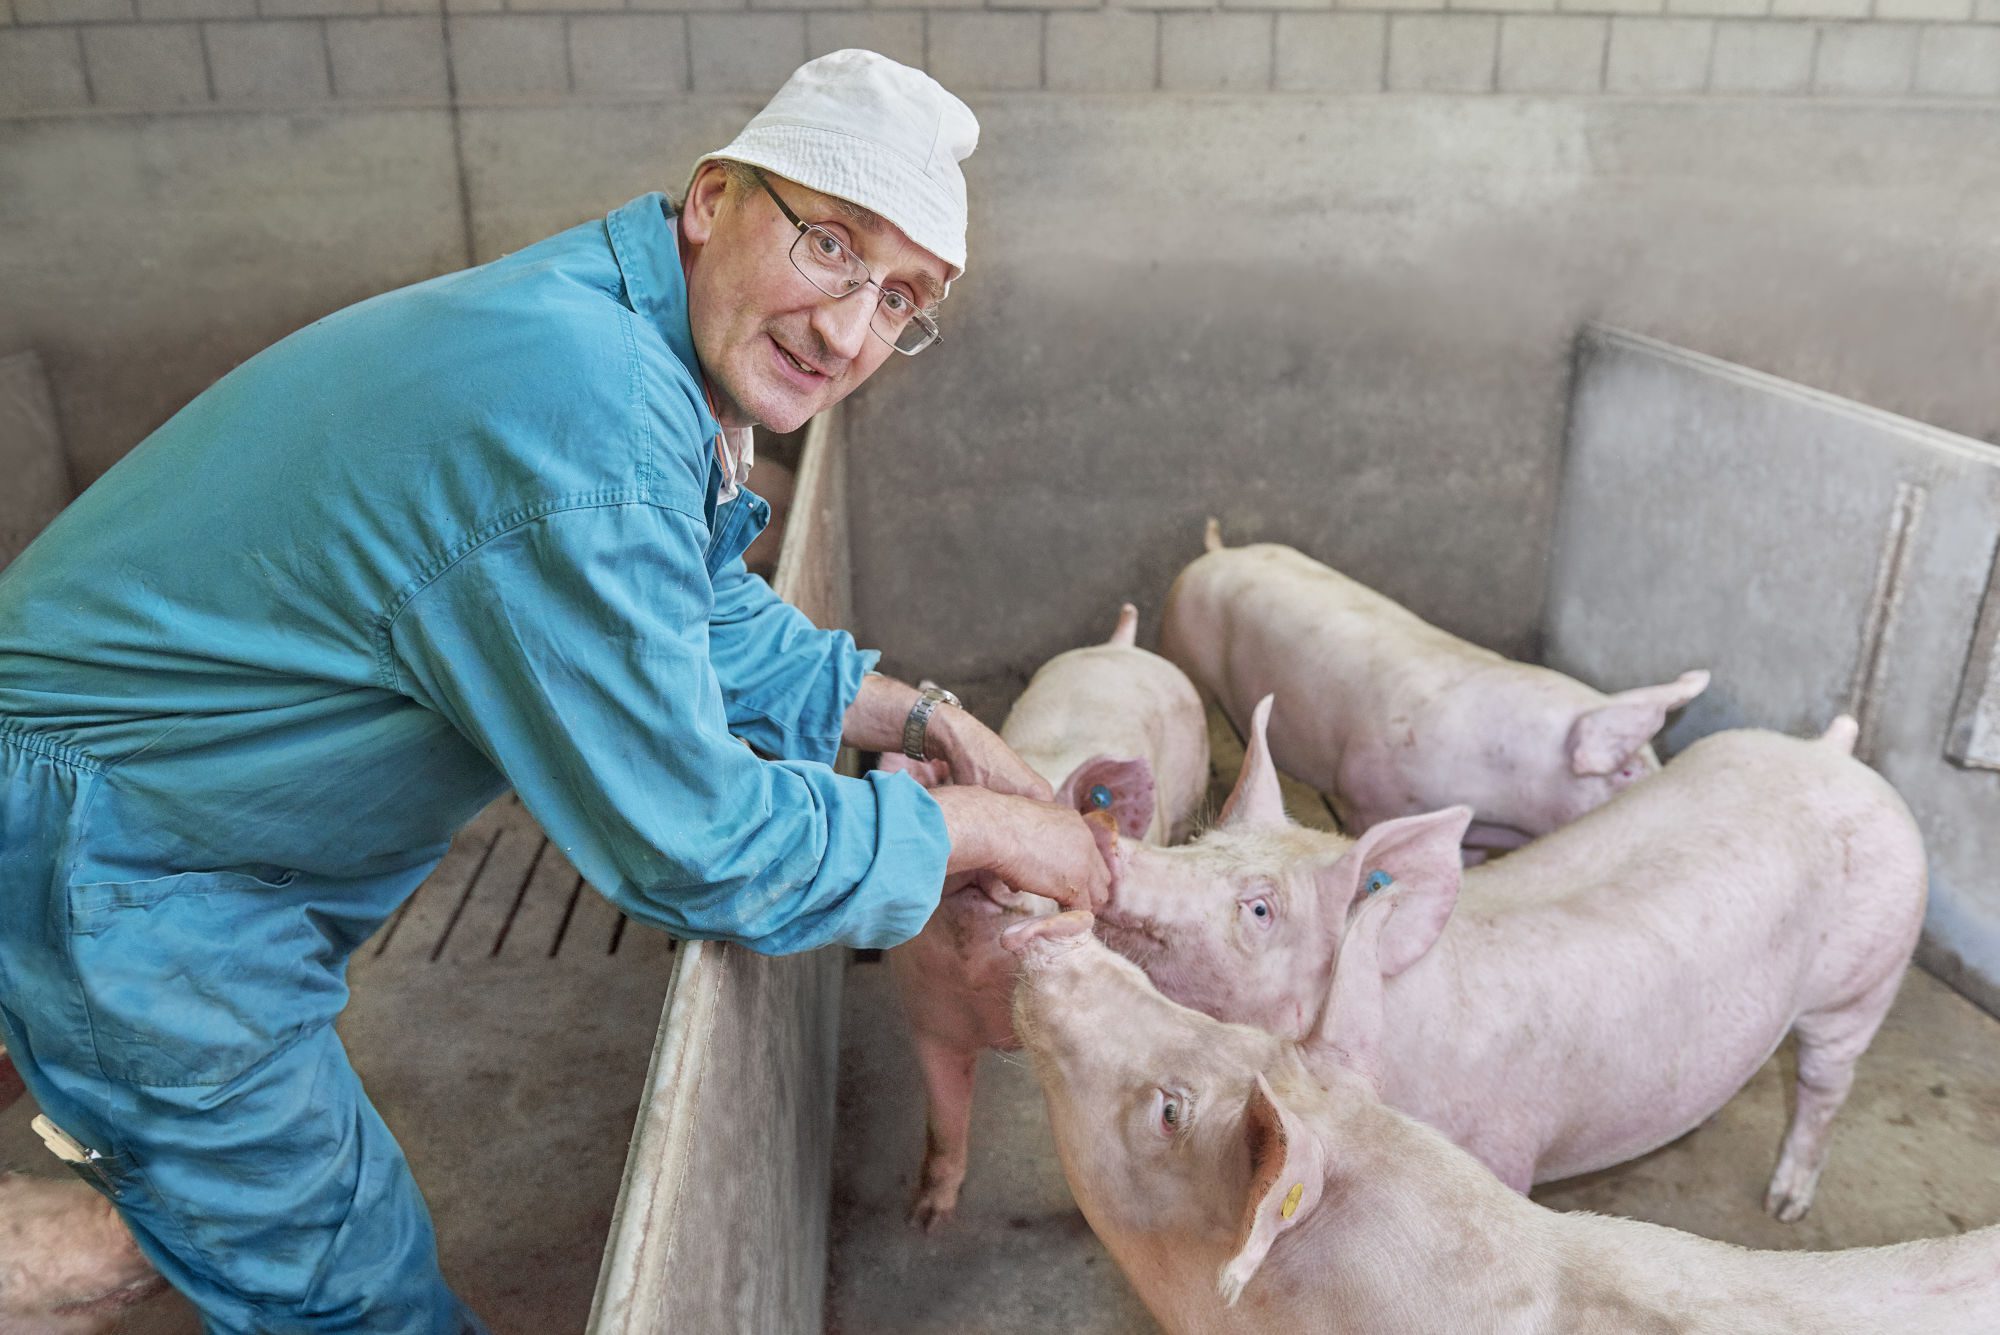
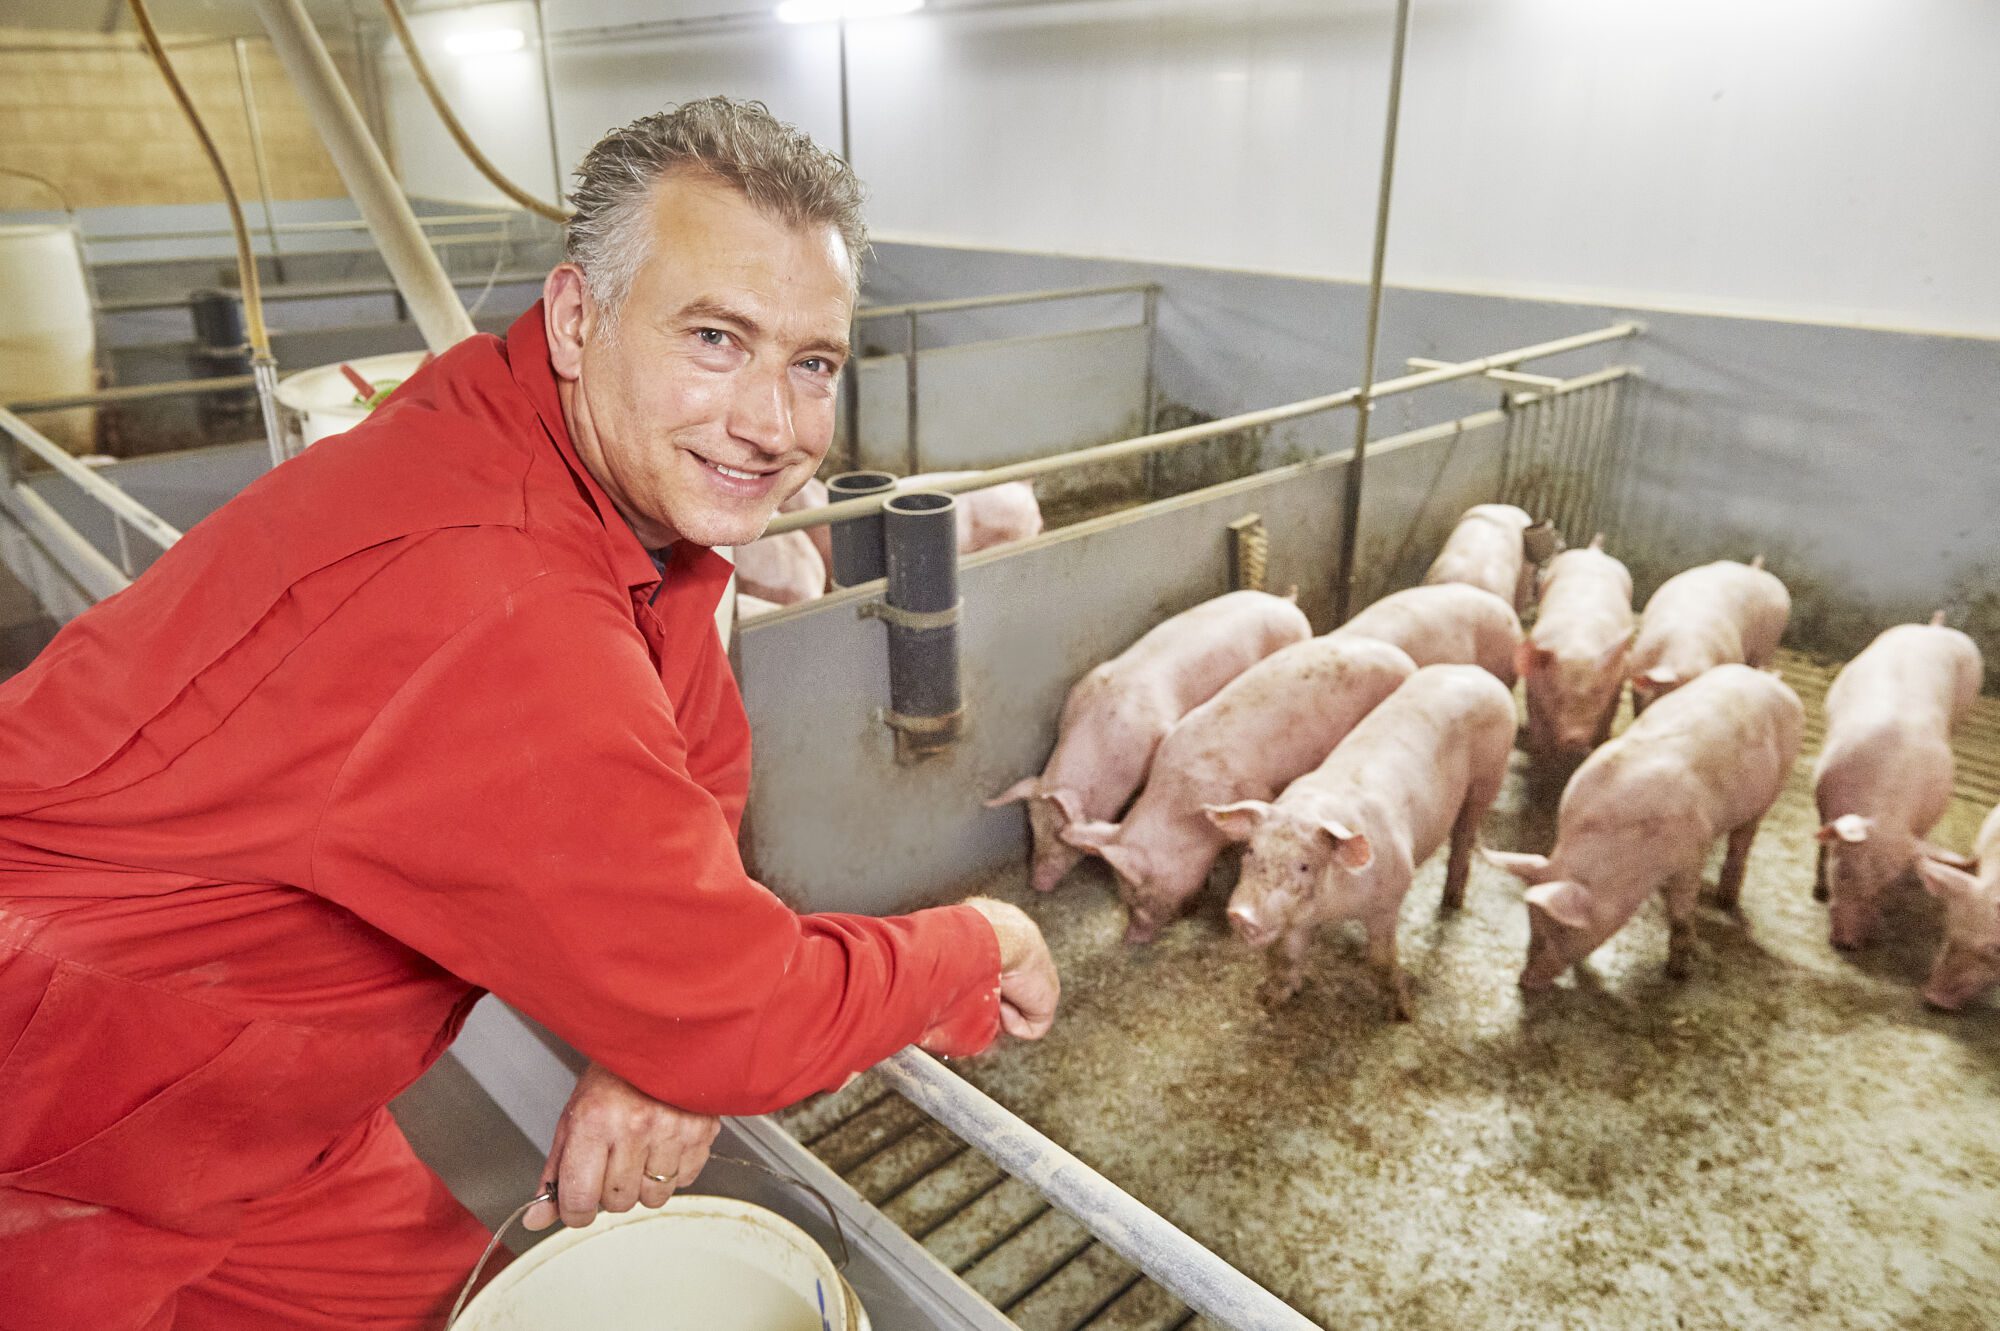
Pork and dairy beef, the main products of Vion, are healthy and delicious products, with –as we know now due to our calculations– a competitive carbon footprint. This is mainly caused by the high efficiency of the farming systems in Germany and the Netherlands, and especially for pork due to the use many by-products from the food industry as feed constituents. These by-products, which are full of good nutrients for humans, are nonetheless preferred not to be eaten by humans or are simply inedible. Pigs, however, turn these nutrients into meat and thus into good, nutritious food. Similarly, dairy cattle are kept primarily for the production of milk. At the end of their life, they also prove to be a good source for nutritious beef.
As such, both animal species are well equipped to serve an important role in a circular economy: an economy with minimal waste, with respect for the planetary boundaries. And we provide a visible quantification of these insights through the carbon footprint. We provide these insights to our customers to enable them to communicate this information to the consumers to allow for a rational, informed and sustainable choice when it comes to eating habits.
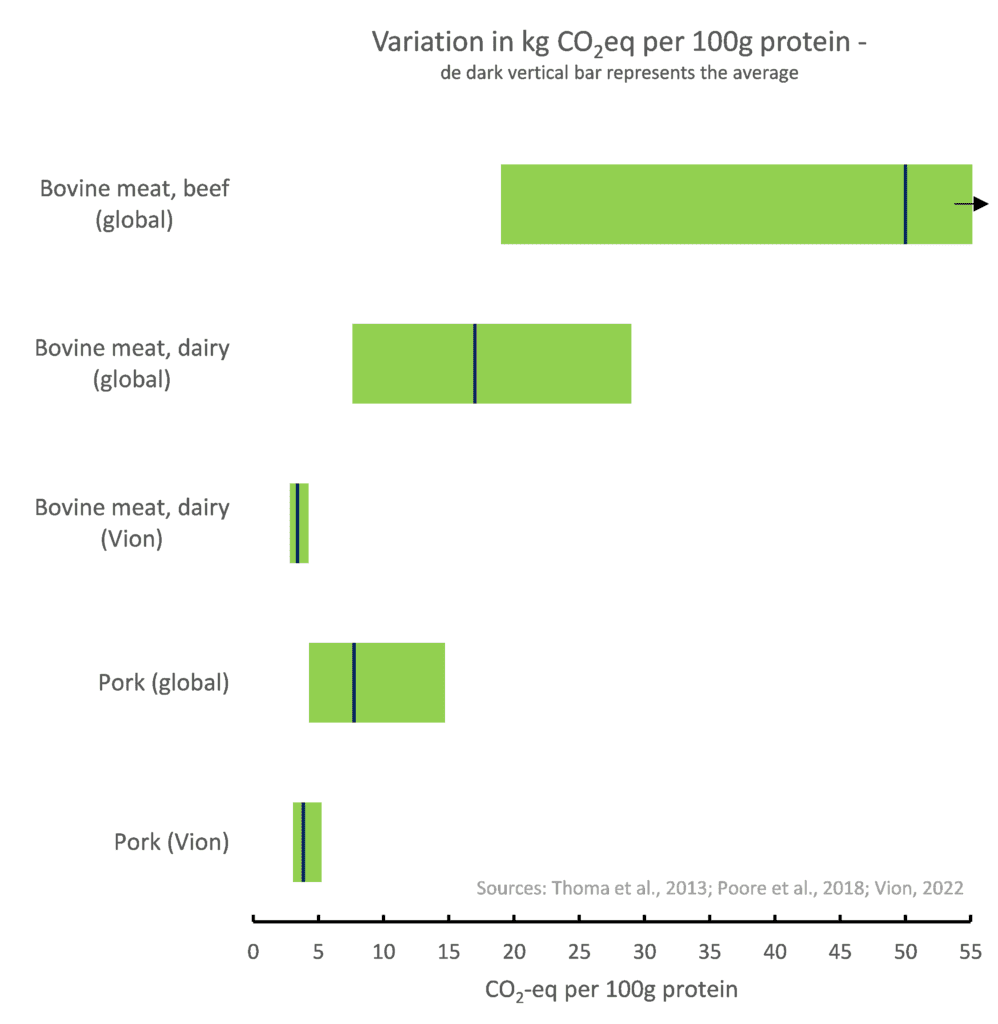
Figure 1 Average carbon footprint of Vion pork and beef, compared to worldwide averages for beef and pork. The horizontal bars indicate the range in outcomes (covering 95% of results), the vertical stripe within these bars indicates the average.
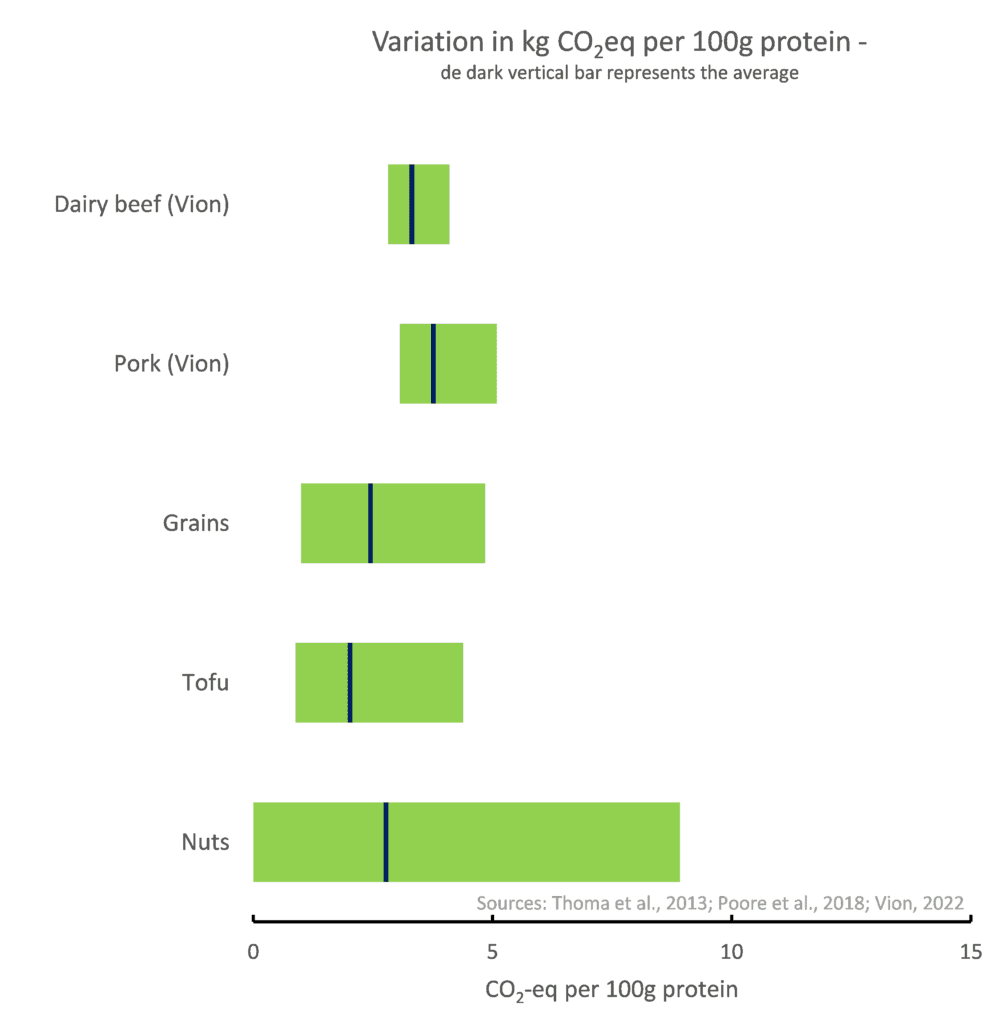
Figure 2 Average carbon footprint of Vion pork and beef, compared to several alternative protein sources. The horizontal bars indicate the range in outcomes (covering 95% of results), the vertical stripe within these bars indicates the average.
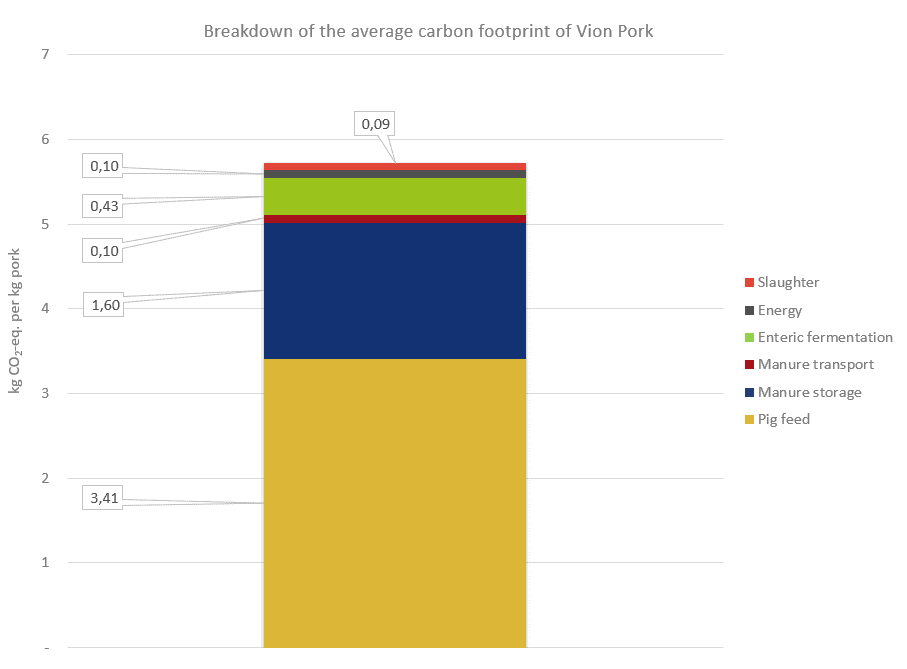
Figure 3 Example of the breakdown of the carbon footprint of pork into different components.